ROLE
DDURATION
TEAM
SKILLS
TOOLS
OVERVIEW
As brand sales teams manage hundreds of stores across wide regions, the lack of centralized diagnostic tools and the heavy reliance on offline spreadsheets led to inefficiencies and delayed decision-making. To address this, we designed an internal enterprise sales dashboard within Xuanyuan, Alibaba’s merchant management platform for the food delivery business.
This project focused on digitalizing the data drill-down workflow for enterprise sales managing top-tier brands. The dashboard supports real-time performance tracking, multi-level issue detection across brand, region, and store, and provides AI-powered recommendations to help both junior and senior sales teams collaborate more effectively and take smarter actions.
IMPACT & HIGHLIGHT
The dashboard has been launched across multiple regions to support brand sales teams in diagnosing performance issues more efficiently. By replacing manual spreadsheets with an integrated tool, we enabled multi-level data drill-downs, AI-powered suggestions, and real-time alerts. The result is faster decision-making, reduced operational friction, and better cross-regional coordination. Detailed metrics remain confidential under NDA.
EXPLORATION
To kick off the project, I tacked with PM and engineering team with existing user and product insights. The goal of this phase was to understand enterprise sales workflows and the broader business needs behind merchant performance management. We collaborated with product managers, engineers, and multiple sales roles to define the problem scope and align cross-functional expectations.
Defining Platform Context
We first need to understand our user differences in platfrorm context. XuanYuan is an internal merchant management system used by sales teams within Alibaba’s food delivery platform, Eleme. It serves two core sales roles, which are single-store sales and enterprise Sales. These distinct user needs require differentiated workflows and interfaces within the platform.

Manage local, independent merchants via frequent offline visits. They rely heavily on mobile tools and personalized service.

Oversee large-scale chain merchants with operations across multiple cities and regions. They depend on performance metrics, and data-driven collaboration with enterprise clients’ brand operations teams.
Understand Business Goals
Through discussions with the PM and sales leaders, I identified several core business goals from platform perspectives as follow. These insights helped define the product's functional direction, building a standardized brand diagnosis system to support sales execution at scale.
PROBLEMS
Defining User Needs & Workflow Breakdown
To understand how enterprise sales work differently from single-store sales, we conducted 10 in-depth user interviews with a mix of new and experienced sales across regions. The goal was to understand their daily workflows, challenges in diagnosing brand issues, and expectations of the new product.


Based on our interviews, we mapped the current workflow from issue discovery to client follow-up. This helped us surface gaps in tooling, inefficiencies in handoffs, and unmet data needs.

From this sales workflow map we can clearly define current challenges:
Manual search wastes time: Without a unified brand-level view, sales rely on fragmented spreadsheets, leading to low accuracy and duplicated effort.
Too much data, hard to locate problems: Sales cover hundreds of stores across multiple cities, making it difficult to filter signals from noise.
Skill gaps limit problem-solving: Sales teams vary in data fluency. Some struggle to identify root causes or interpret patterns without clearer platform support.
While some existing internal components could visualize basic metrics, a significant portion of our diagnostic logic required new interaction paradigms to handle multi-layered drill-down and issue categorization. Due to the internal nature of our tool, it was difficult to find truly comparable competitors. However, through conversations with the sales team, I was connected to a former employee of a competing company and conducted an informal interview to gather insights.
A Highly Granular
Data Modules
Competitor dashboards allowing users to engage based on their habits and data literacy flexibly.
Recommendation Precision is A Priority
With the system regularly improving through a feedback loop between the sales team and the algorithm team.
GOAL AND METRICS
Focusing on Driving Sales Efficiency
As a core solution for enterprise sales teams, the dashboard is designed to streamline issue detection and operational execution across large-scale merchant networks. To evaluate its impact, we focused on three key metrics: user retention, task efficiency, and user satisfaction.
User Retention
Track weekly active users and 7-day return rate to measure stickiness and usage consistency.
Task Efficiency
Measure time-to-locate issues and number of manual steps replaced by dashboard workflows.
User Satisfaction
Monitor suggestion usage rate and feedback actions to assess confidence in system guidance.
DESIGN PRINCIPLES
To guide our design decisions, our team collaborated closely with sales, product, and technical stakeholders to align on principles that balance usability, business value, and adaptability across user types.
Empower with Insight
Make data approachable for all sales levels by turning complex metrics into clear, actionable insights. Design should bridge the gap between data and decision-making.
Empower with Insight
Surface information that drives action. Every feature should help sales not only understand a problem but also take the next step quickly and confidently.
Adapt to Experience
Support both junior and senior sales by balancing simplicity and depth. Start with guidance and defaults, then reveal advanced tools as familiarity grows.
Turn Manual Excel Workflows into Scalable Dashboards
The first design phase aimed to transform existing Excel-based workflows into a scalable, visual dashboard. Our goal was to reduce manual effort and help sales quickly scan brand and store performance issues across multiple regions.
Map Sales Data into Modular Diagnostic Layers
We conducted a detailed audit of existing spreadsheet data used by sales, identifying key metrics such as store health, conversion rate, fulfillment, and product mix. These were then grouped into modular categories and reorganized by diagnostic layers—brand, region, and store—to define the dashboard’s structural logic.
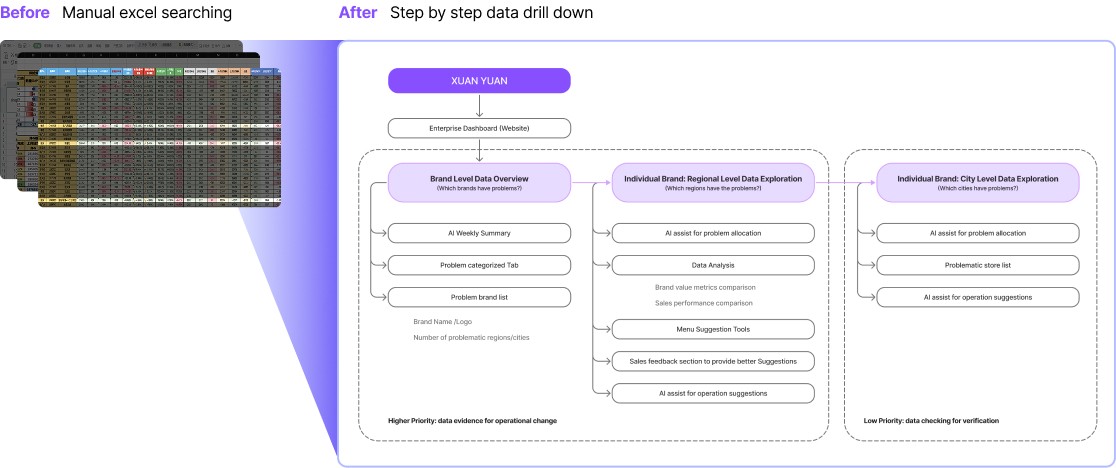
MVP1: Designing a Multi-Layer Drill-Down Flow
Using the mapped data structure, we explored multiple layout variations focused on information density, scanability, and priority cues. Our goal was to ensure that the dashboard supported issue-first navigation, enabling sales to locate anomalies within seconds.

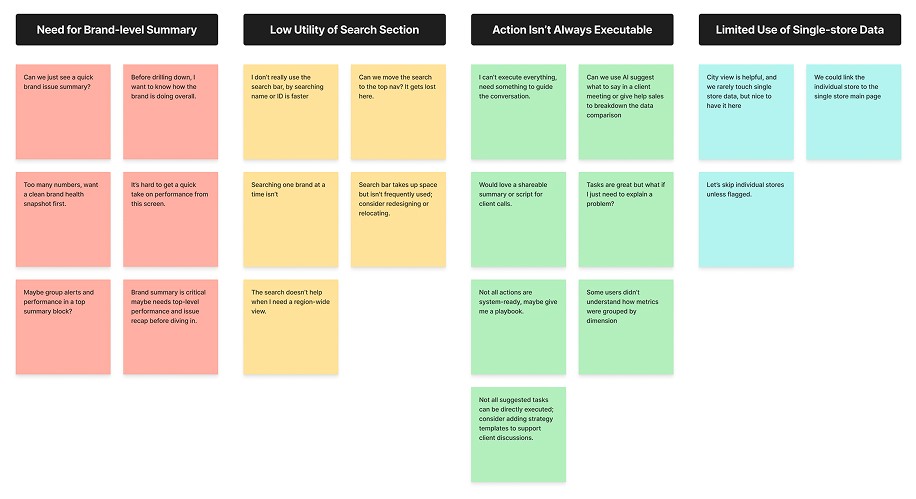
Synthesizing Cross-functional Insights for Iteration
After releasing the first prototype, we conducted feedback sessions with PMs and senior sales. Through an affinity mapping workshop in FigJam, we identified four key areas of improvement, laying the foundation for the next iteration focused on execution support.
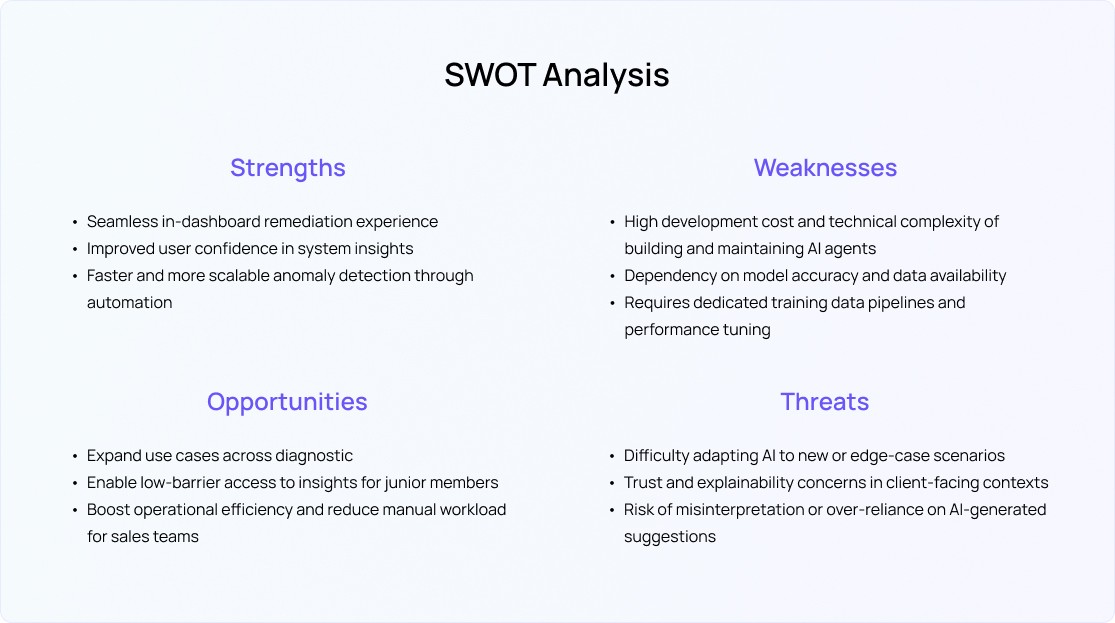
SECONDARY RESEARCH
Exploring Opportunities for AI Integration
To identify whether AI could enhance issue diagnosis and actionability within the dashboard, we began with a SWOT analysis to evaluate potential benefits and challenges. This was followed by mapping out specific application areas where AI could support sales workflows.
How We Use AI?
To better understand the feasibility of AI integration, we audited our current touchpoints and explored potential enhancement opportunities. We identified several practical AI applications across the dashboard experience. This investigation laid the groundwork for designing a smarter assistant experience, explored in the next section.
Insight Summarization: Automatically highlight key trends and risks from weekly performance data
Search Assistance: Help users navigate by suggesting relevant brands, alerts, or summaries


Contextual Suggestions: Recommend actions based on issue types, client history, and business impact
Sales Playbook Support: Offer message framing or talking points to assist sales in client conversations
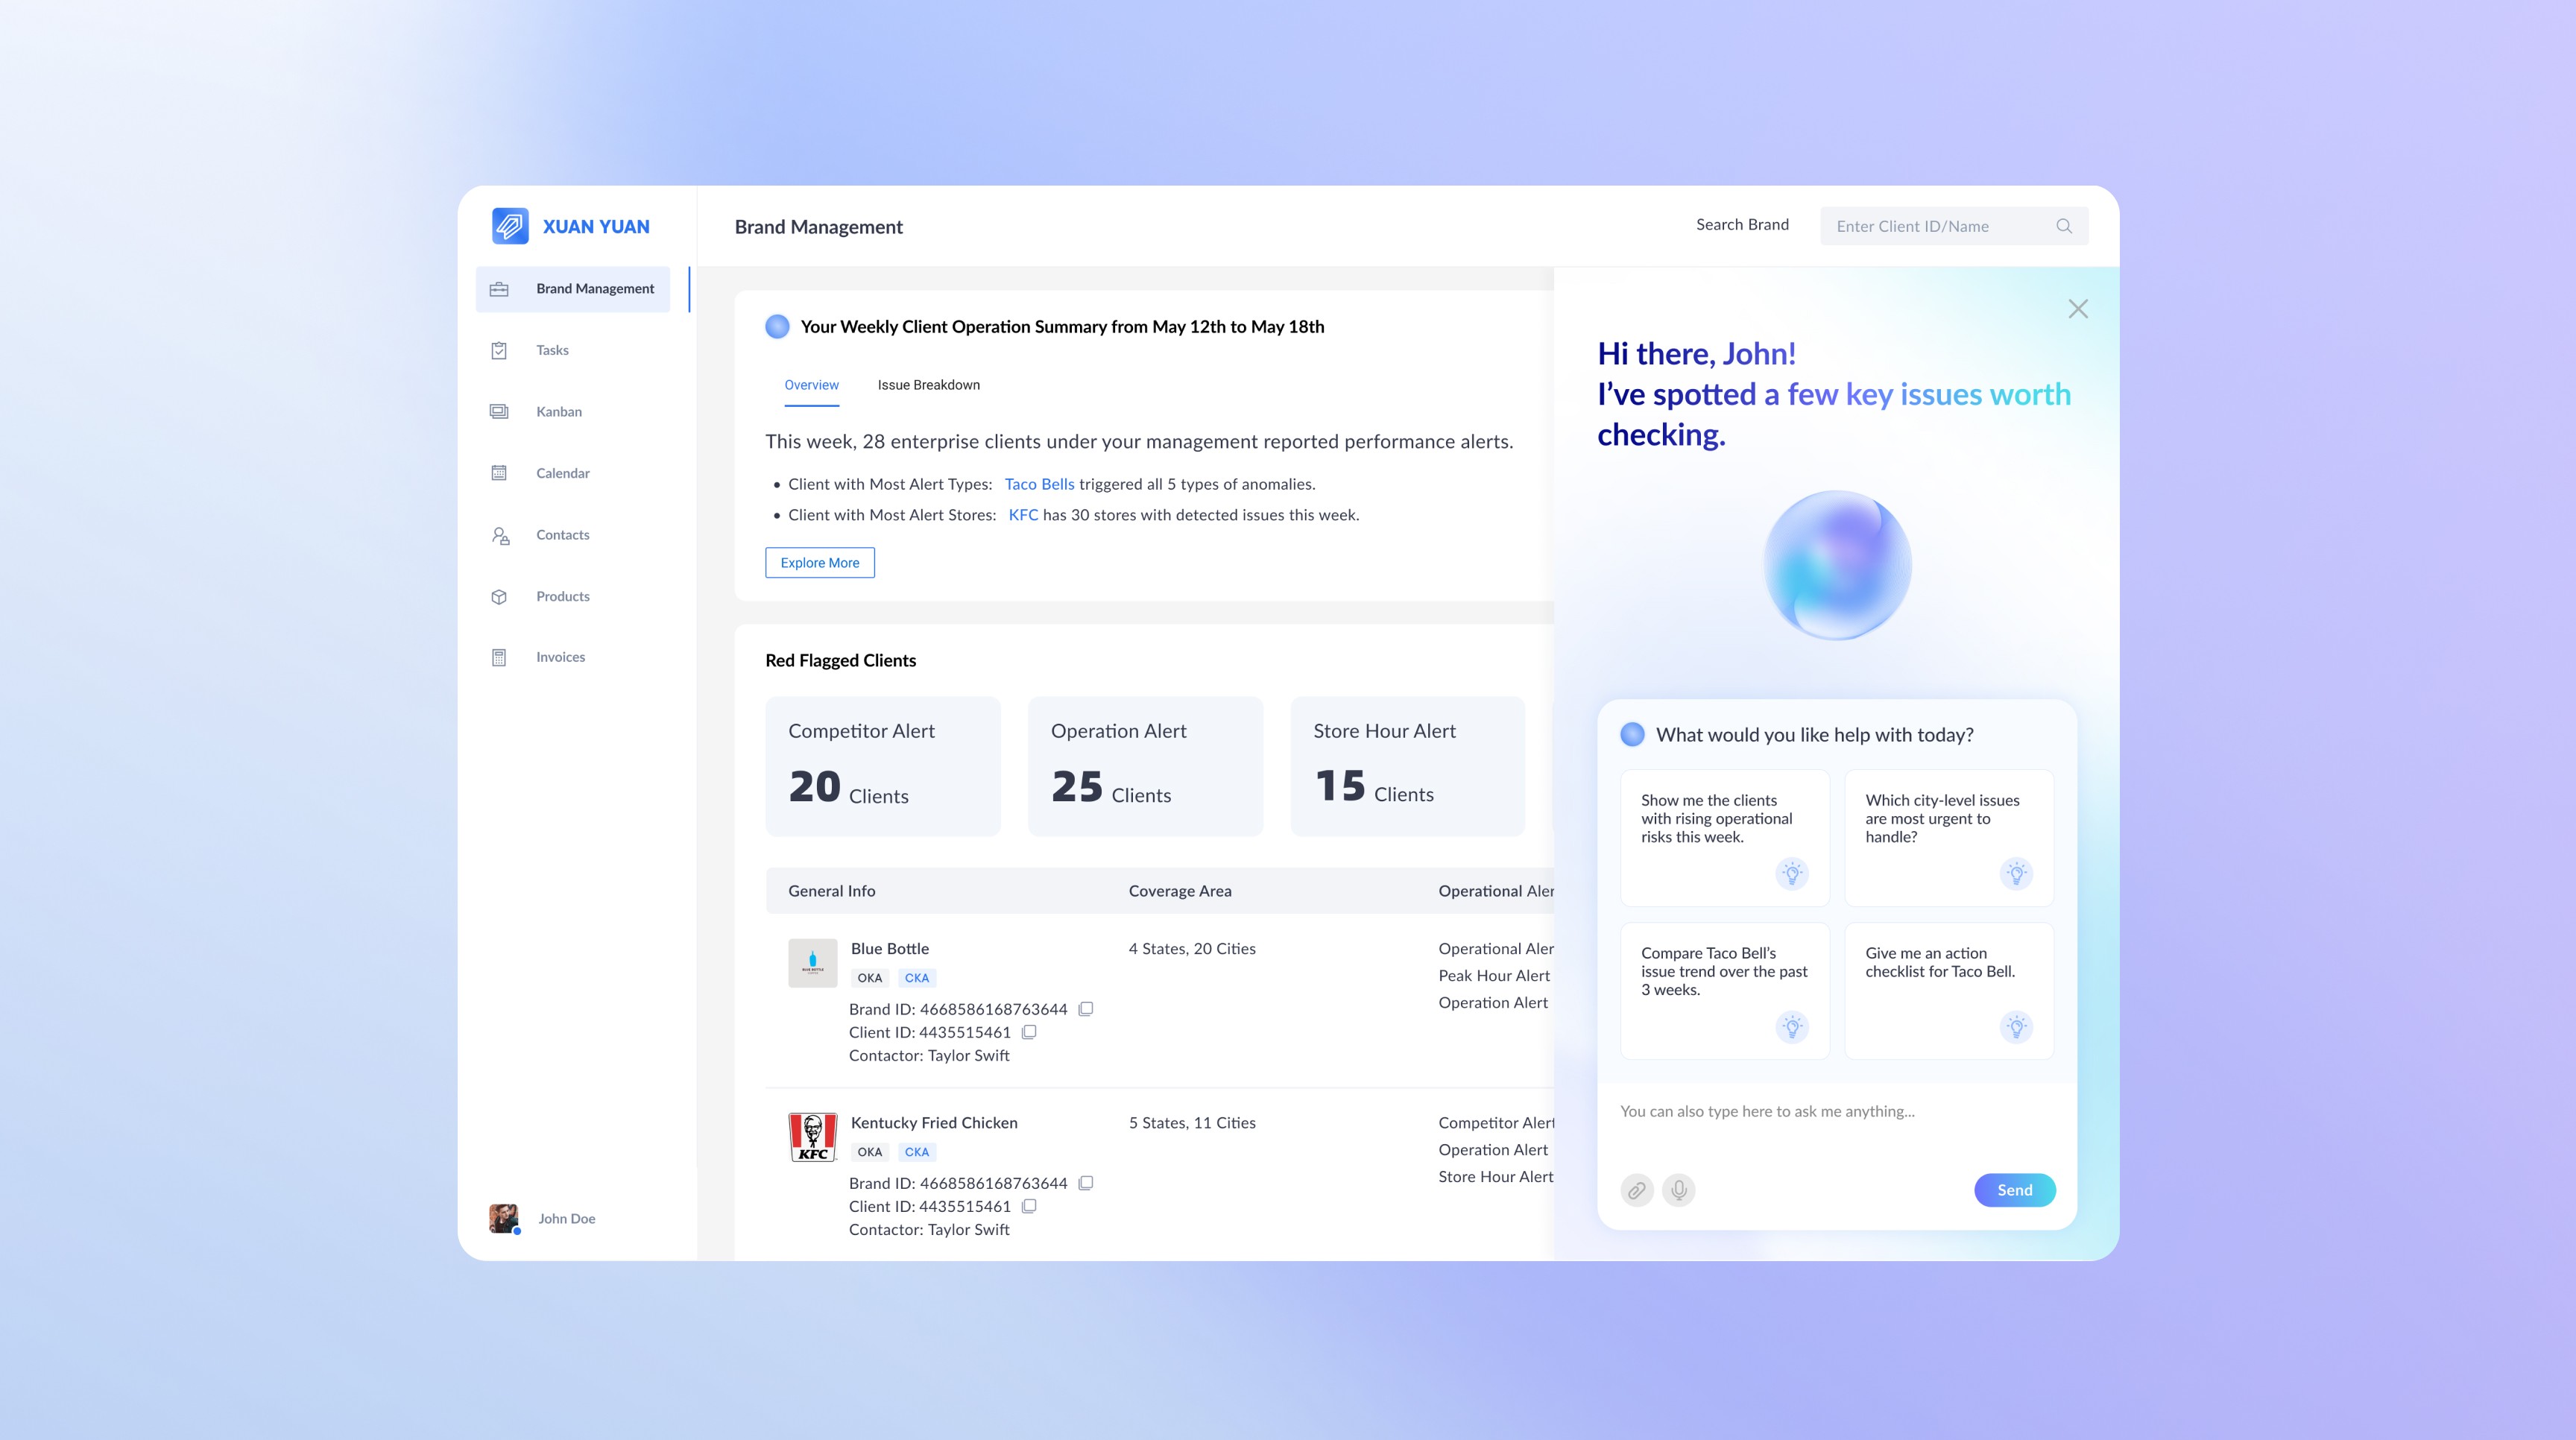
FEATURES SUMMARY
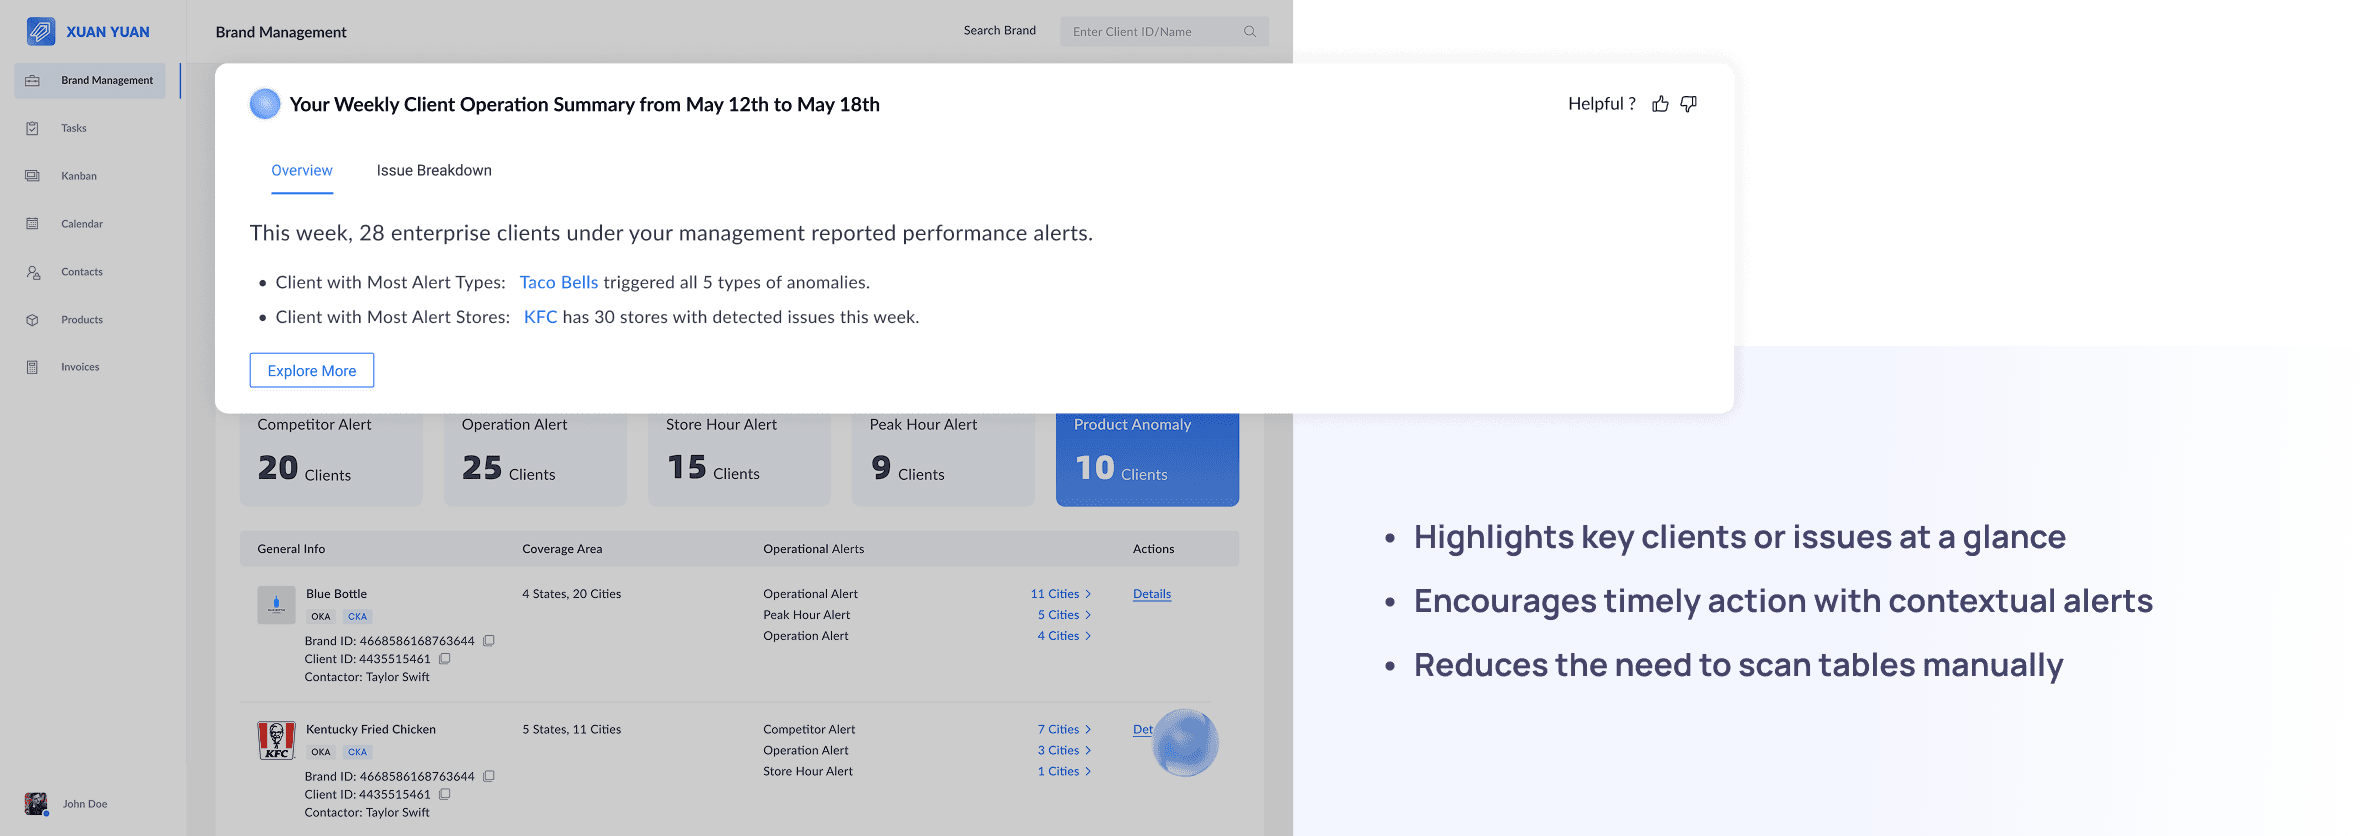
01: Help users understand what matters without digging through rows of data.
We introduced a summary block directly on the dashboard, offering quick takeaways on brand-level anomalies and weekly client activity.
02: Assist sales in recommending specific menu adjustments based on data trends.
In addition to surfacing issues, the assistant also generates actionable suggestions, such as recommending underperforming products for replacement or highlighting popular SKUs in competitor regions.

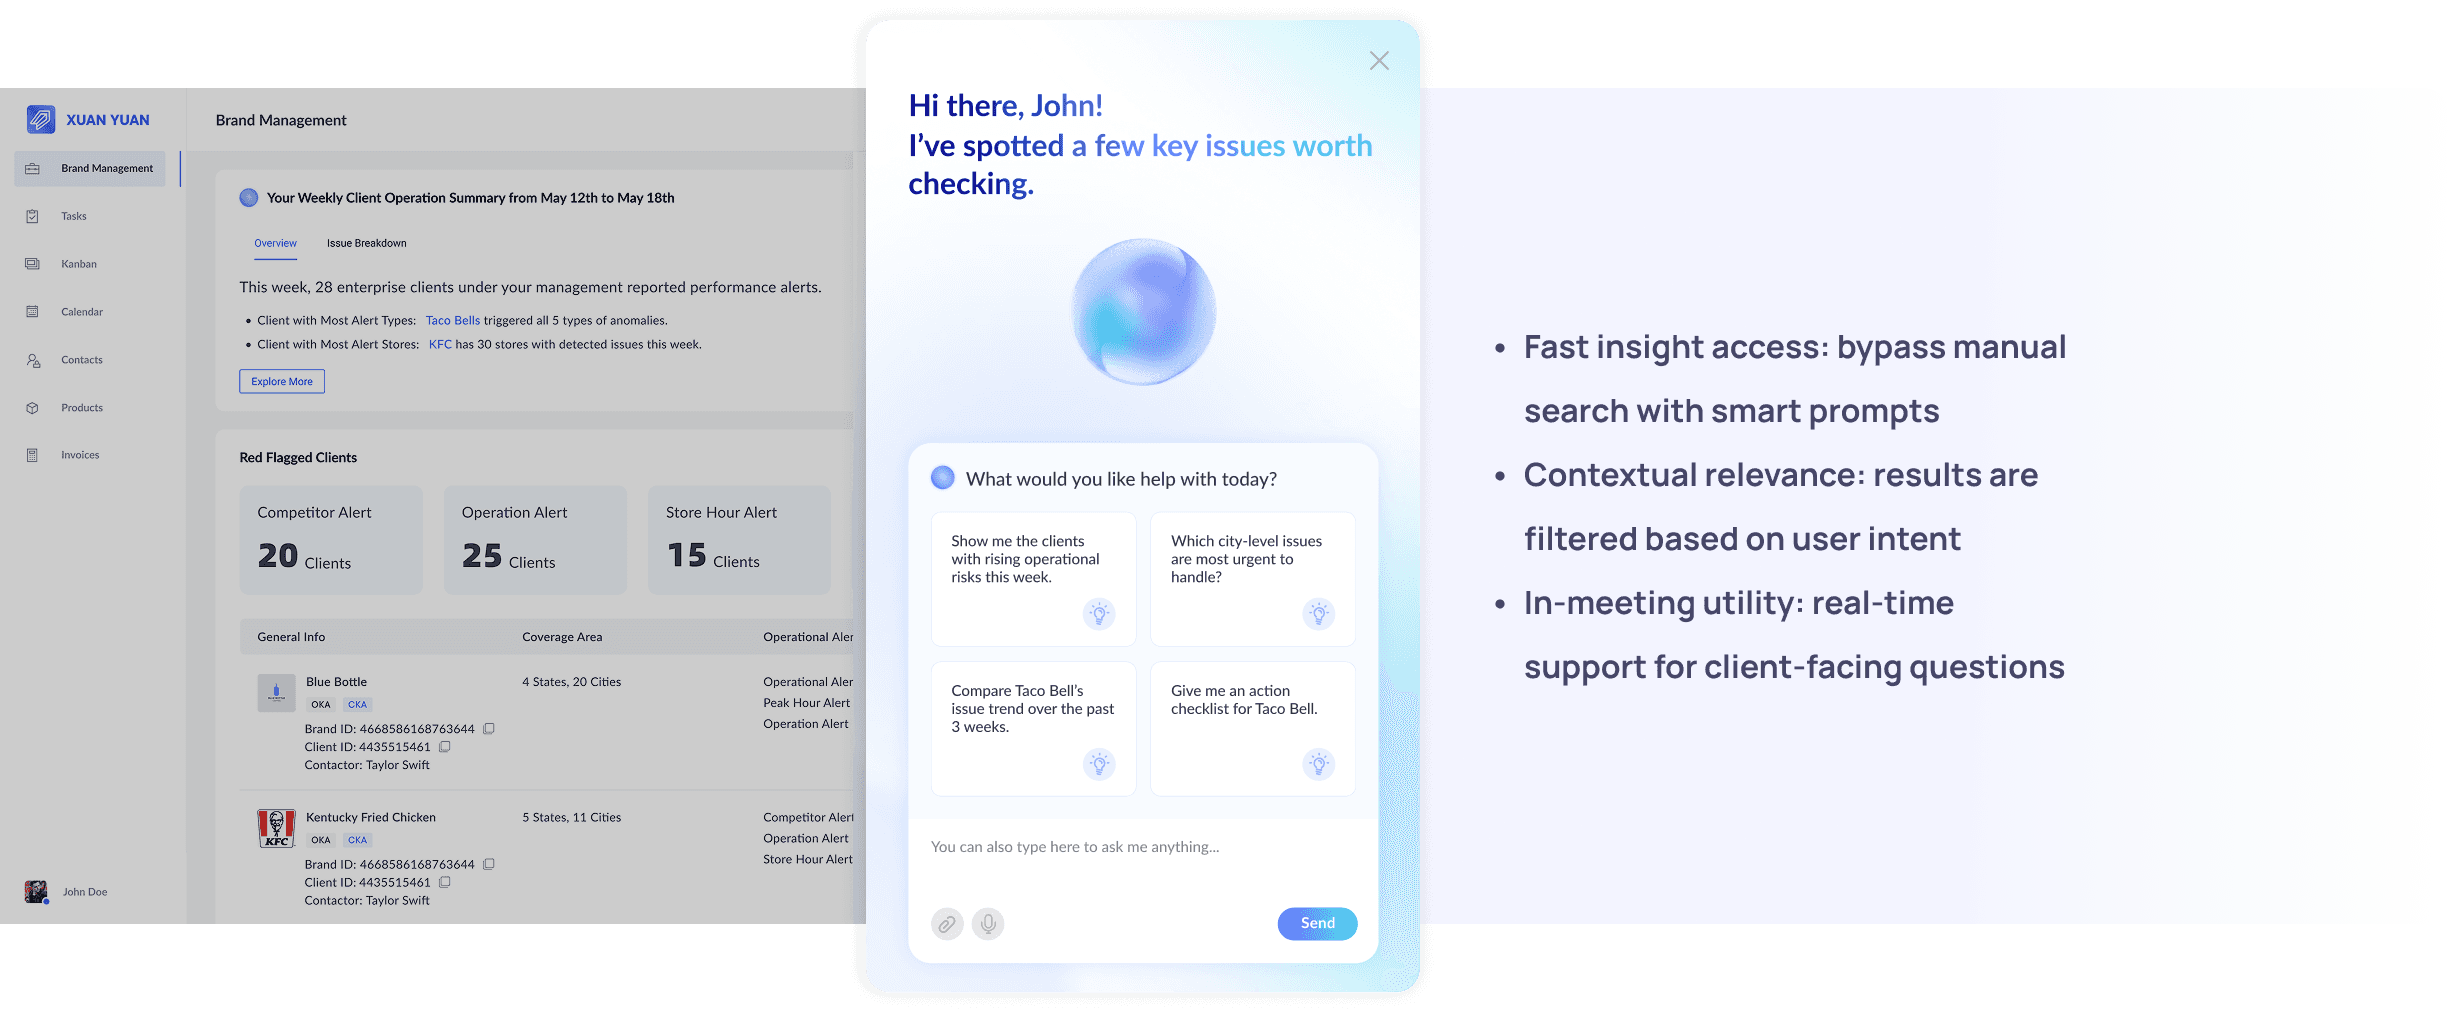
03: Accelerate data retrieval and support less-experienced sales during client interactions.
To reduce reliance on manual searching, we introduced a global AI assistant designed to help users quickly locate relevant data across regions and brands. Especially helpful for junior team members, this assistant enables faster ramp-up and confident client conversations.

IMPACT & HIGHLIGHTS
To evaluate the real-world impact of this internal dashboard, we measured its performance across key areas like task efficiency, decision support, and collaboration. The tool not only reduced operational friction but also empowered teams with faster, clearer, and more aligned actions.
User Retention
Track weekly active users and 7-day return rate to measure stickiness and usage consistency.
Task Efficiency
Measure time-to-locate issues and number of manual steps replaced by dashboard workflows.
User Satisfaction
Monitor suggestion usage rate and feedback actions to assess confidence in system guidance.